Posts

Impact of Rain on the 2017 Vintage

Image
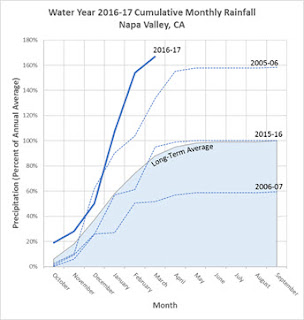
The previous post discussed recent Napa Valley vintages. This post discusses one important impact on the 2017 vintage - RAIN! Napa Valley average rainfall is 20" per year. The chart shows summary rainfall statistics over the course of the year. The y-axis shows rainfall as a percentage of average with 2015-16 being a typical year that matches the average. The x-axis shows the month of the year.  The chart runs from October thru September because that reflects the growing season. 2005-6 had 160% of normal and 2006-07 had 60% of normal rainfall, that is, 32" and 12" respectively.  You can also see that 2016 rainfall through March is already over 160% of normal. Another important point illustrated by this chart is that the majority of rainfall happens between November and April which includes the dormant season through bud break which is perfect. An important viticulture principle is to "stress" the vines because that encourages a vine to put energy

Recent Napa Valley Vintages

It is important to remember that agriculture is an important aspect of the wine business. You cannot produce high quality wines with poor grapes. Challenges are everywhere for grape growers:  Warm weather with adequate rain are essential.  Rain early in the season followed by sustained warm temperatures is optimal for producing outstanding grapes at harvest. Good vineyard practices are essential to reduce pests and diseases [ Wine Science & Applications ]. Air pollutants such as ozone, sulfur dioxide, and wildfire smoke can alter the aroma, taste, and healthiness of harvested grapes. Costs continue to increase over time due to the cost of land, labor, and materials. Natural disasters like the South Napa earthquake in Aug 2014. So every year is unique often producing unexpected challenges.  For example, the 2011 Northern California vintage had a cooler-than-average growing season with a late harvest impacted by autumn rainstorms. The time grapes can hang on the vine (hangti